
How to use Google BigQuery to create a Dashboard by using Data Studio.
Hello everyone, today I want to show you how to use Google Data Studio to create an Interesting BI dashboard by using BigQuery. What I want to discuss is how to use BigQuery to create a BI Dashboard by using Google Data Studio.
Let us assume that you are working in a company where you have to to track, analyze and report one dataset that is daily updated on key performance indicators that your company requested to you. You can perform this by using business intelligence dashboard.
A BI dashboards typically visualize data in charts, graphs and maps which helps stakeholders understand, share and collaborate on the information.
For this project we wil use Google Cloud Platform as a cloud solution. This problem also can be solved by using Amazon Web Services or Microsoft Azure which will be a subject of another blog post.
Introduction
![]()
BigQuery is a serverless, cost-effective and multicloud data warehouse designed to help you turn big data into valuable business insights. BigQuery is a fully-managed, serverless data warehouse that enables scalable analysis over petabytes of data. It is a Platform as a Service that supports querying using ANSI SQL. It also has built-in machine learning capabilities.
Google Data Studio is an online tool for converting data into customizable informative reports and dashboards introduced by Google on March 15, 2016 as part of the enterprise Google Analytics 360 suite.
Step 1 Uploading queryable data
First we login into our console of Google Cloud Platform (GCP) account

Then we need to pull in some public data so you can practice running SQL commands in BigQuery.
Open BigQuery Console
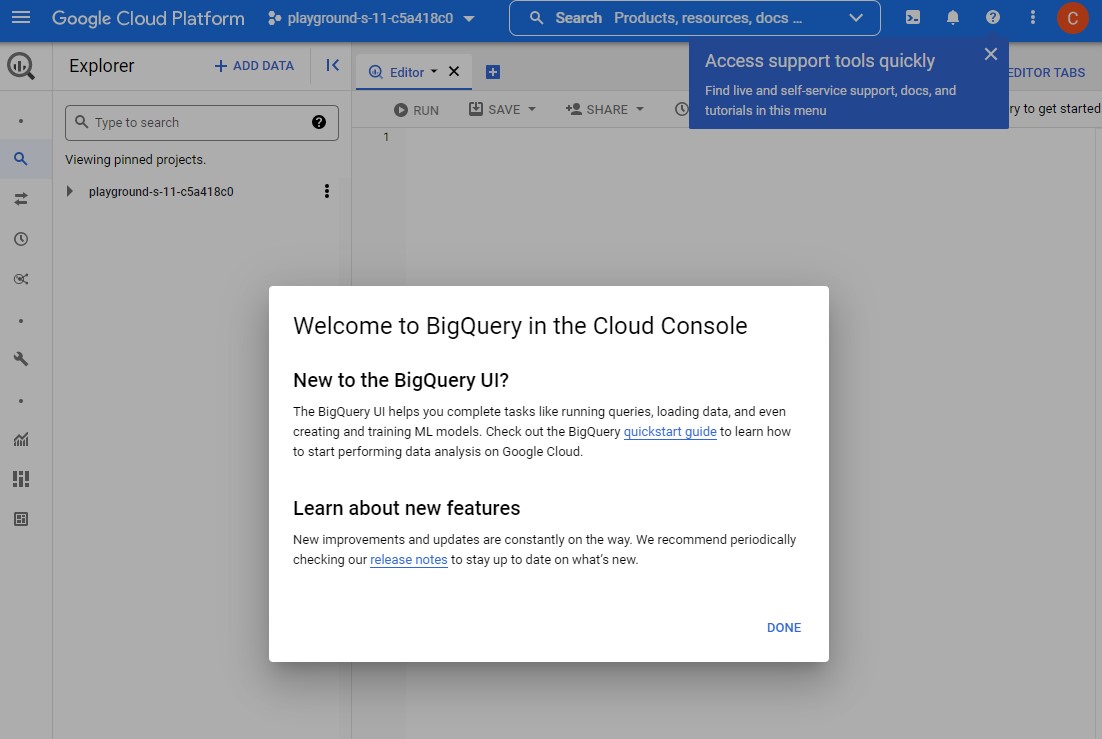
In the Google Cloud Console, select Navigation menu > BigQuery:

The Welcome to BigQuery in the Cloud Console message box opens. This message box provides a link to the quickstart guide and the release notes.
Click Done.
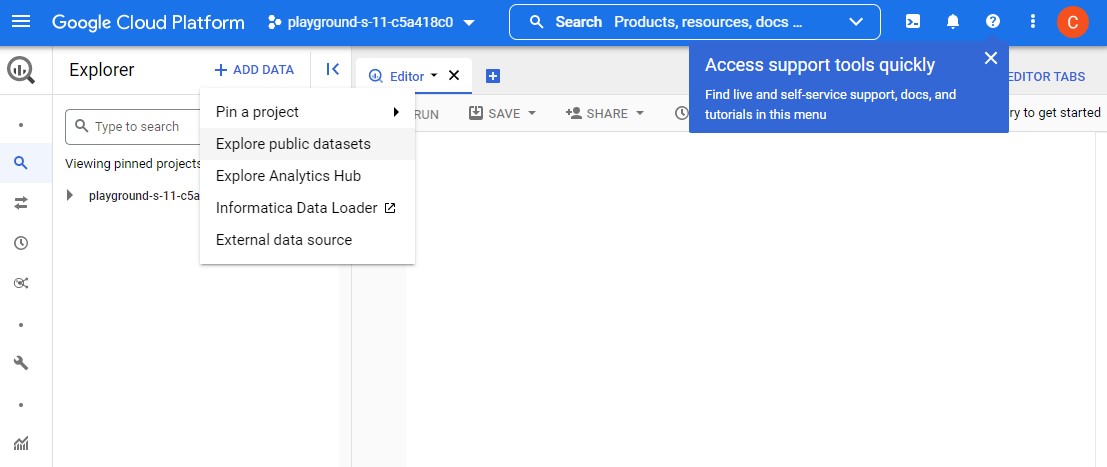
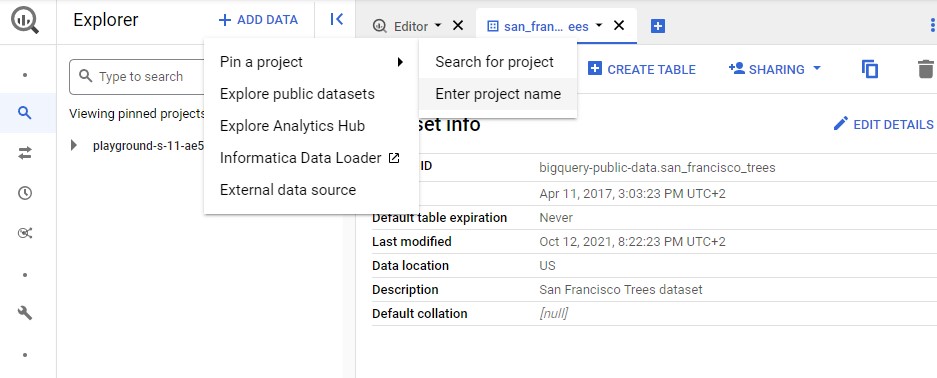
Click on the + ADD DATA link, then select Explore public datasets:
Search for “trees” and press Enter.
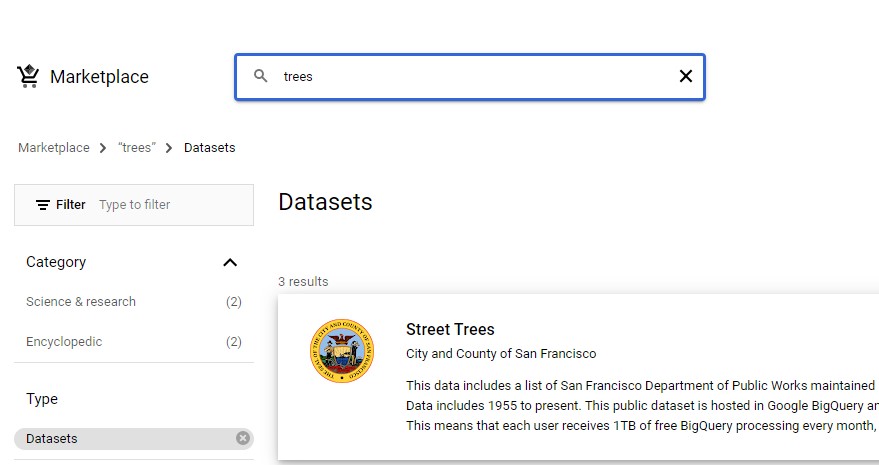
Click on the Street Trees tile, then click View Dataset.
A new tab opens
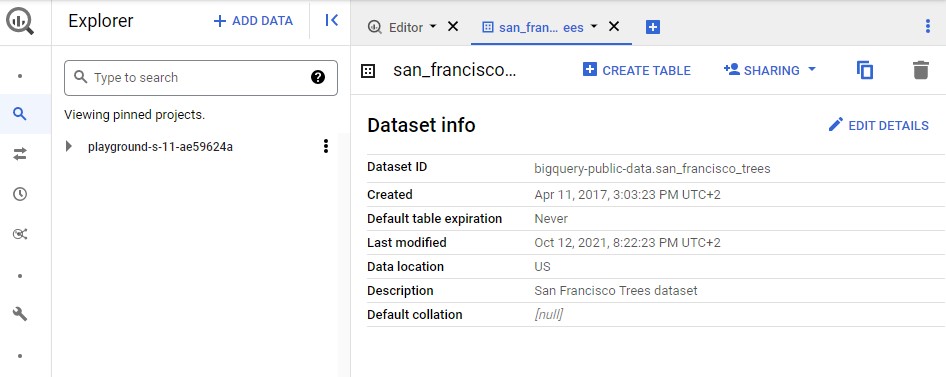
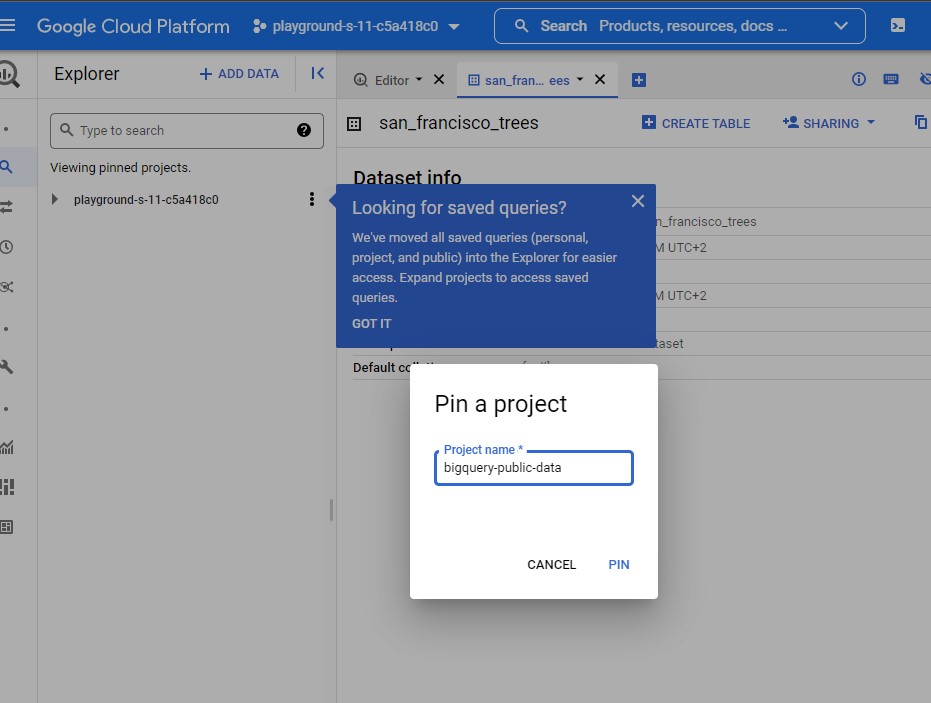
then click on + ADD DATA -> Pin a project -> Enter project name (bigquery-public-data) and Pin.
Step 2 Create a reports dataset in BigQuery
Typically, a dashboard shows an aggregated view of usage . To reduce query costs, we will first aggregate your needed logs into another dataset called “Reports” then create a table of aggregated data.
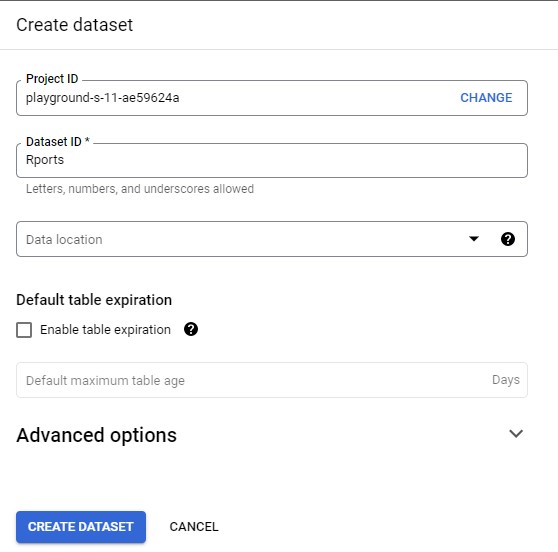
We need to create a new dataset called Reports in your project. A separate dataset has a couple of benefits: it reduces the amount of data queried by the dashboard, and it removes unnecessary access to your source datasets by users who are only interested in aggregated data.
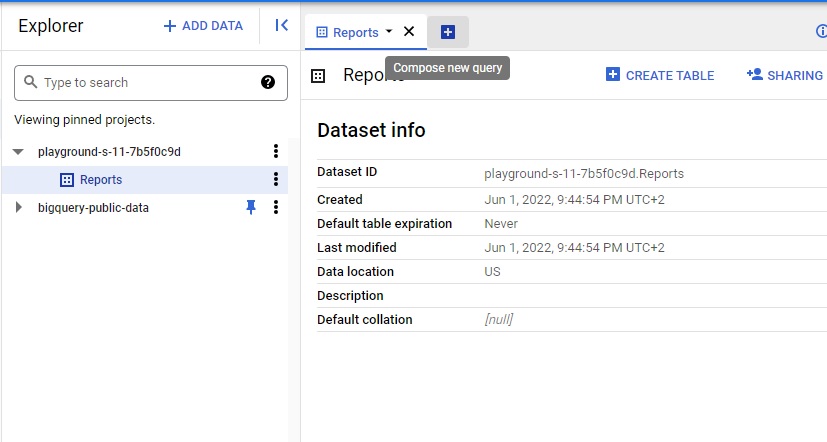
Select your own projec,
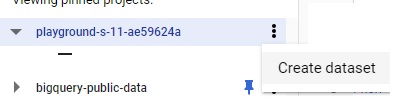
hen Click on Create dataset and call it “Reports”.
Step 3 Query the dashboard data
We se select the new dataset created and we compose a new query
The query string and destination table can be parameterized, allowing you to organize query results by date and time.
Now you add a query that checks each day for new data. When new trees are planted, you’ll get the additional stats updated directly into the reports.trees table.
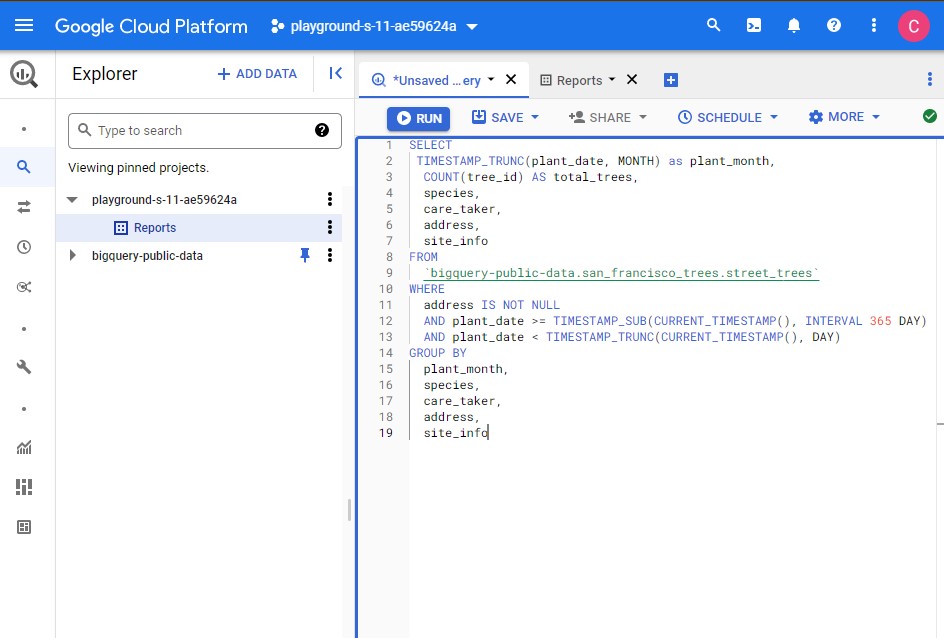
Click Compose New Query and run the following query to pull incremental data into the reports.trees table on a daily basis using the scheduled query feature:
SELECT
 TIMESTAMP_TRUNC(plant_date, MONTH) as plant_month,
  COUNT(tree_id) AS total_trees,
  species,
  care_taker,
  address,
  site_info
FROM
  `bigquery-public-data.san_francisco_trees.street_trees`
WHERE
  address IS NOT NULL
  AND plant_date >= TIMESTAMP_SUB(CURRENT_TIMESTAMP(), INTERVAL 365 DAY)
  AND plant_date < TIMESTAMP_TRUNC(CURRENT_TIMESTAMP(), DAY)
GROUP BY
  plant_month,
  species,
  care_taker,
  address,
  site_info
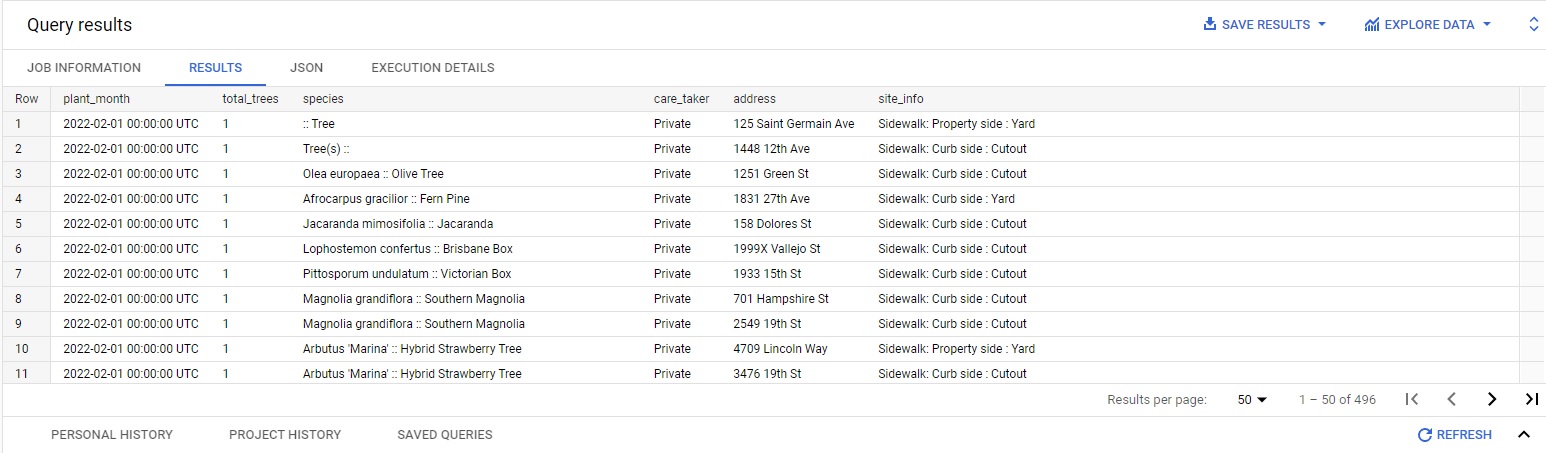
this is a one-time query to pull the data for the last year, summarizing:
- The number of trees planted each month
- Which species of trees were planted
- Who the caretaker of the trees is
- Address of the planted trees
- Tree site information
Click the More button, and select Query settings from the dropdown menu.
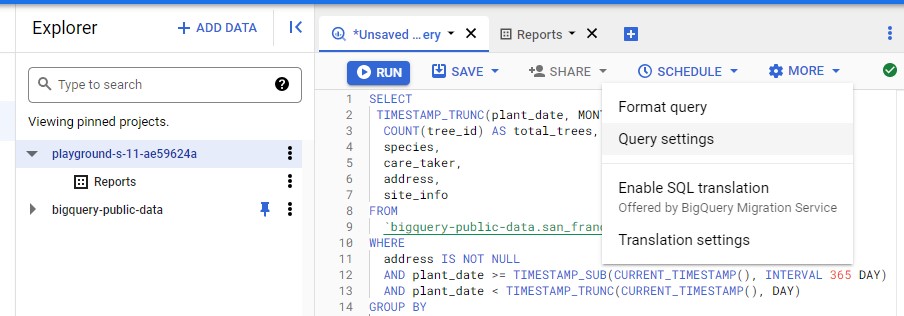
Click the More button, and select Query settings from the dropdown menu.
- Select Set a destination table for query results.
- For Dataset name, type
Reports. - Create a name for the table, like “Trees”.
- For Destination table write preference, select Write if empty.
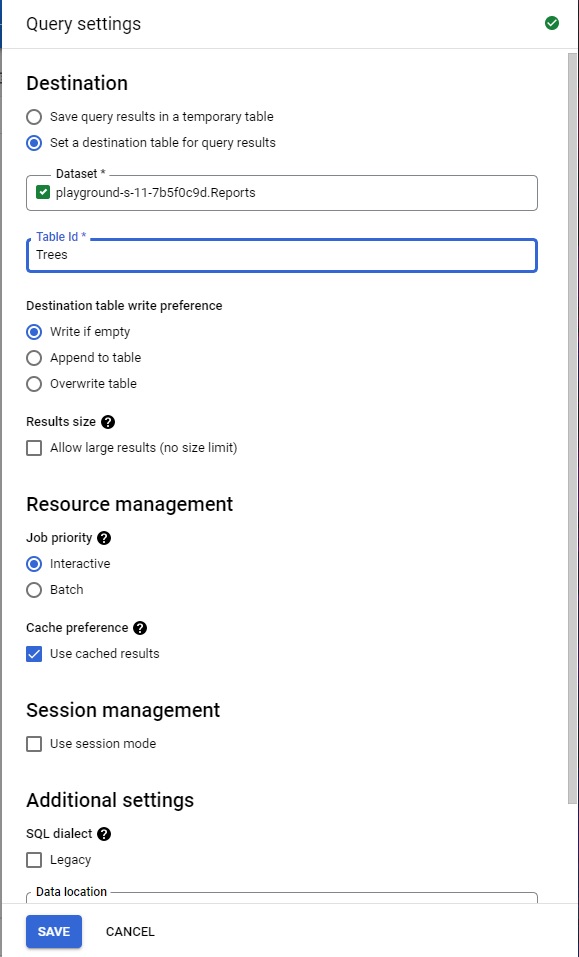
Because you specified a Table name and selected the Write if empty preference, the query creates a table if the table does not already exist.
Accept the other default settings and click Save.
Click Run to run the query.
Step 4 Scheduling queries in BigQuery
We will query the table from the Data Studio dashboard. This way, when the dashboard is refreshed, the reporting dataset queries process less data. Since usage logs from the past never change, we will only refresh new usage data into the Reports dataset.
To keep your dashboard up-to-date, you can schedule queries to run on a recurring basis. Scheduled queries must be written in standard SQL, which can include Data Definition Language (DDL) and Data Manipulation Language (DML) statements.
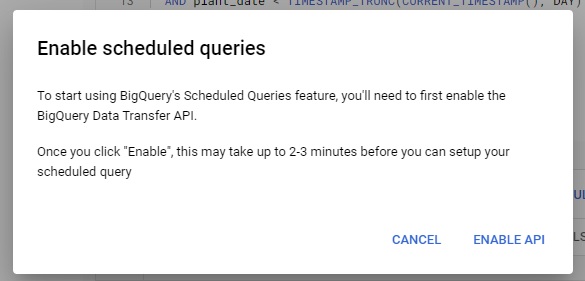
Click on the Schedule button, then Enable Scheduled Queries
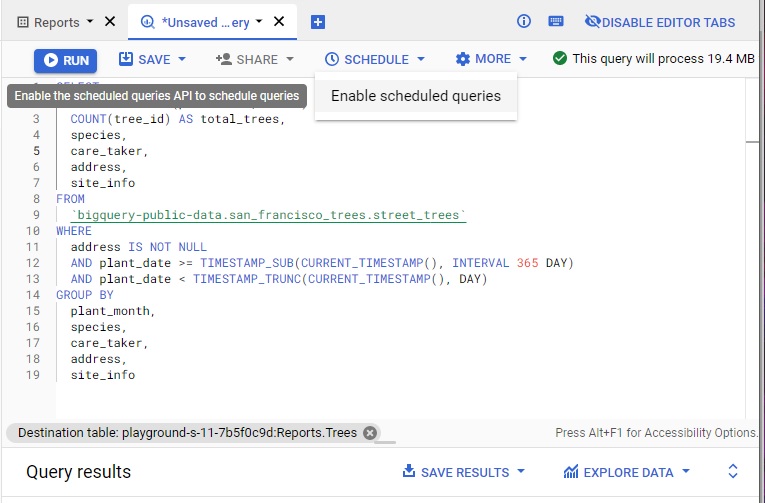
and enable API
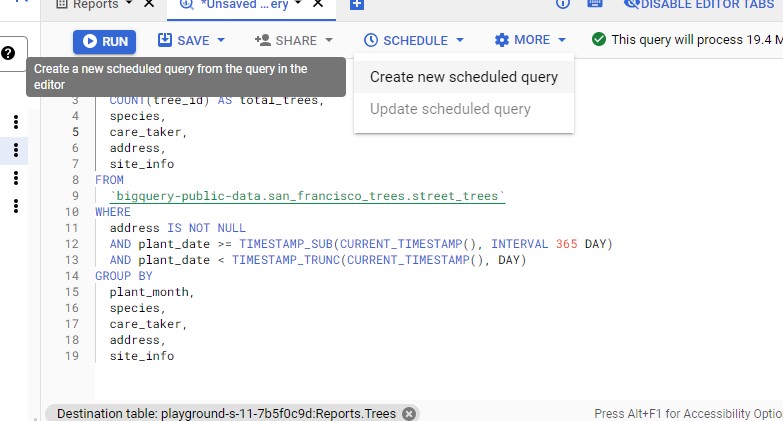
Click on the Schedule button, then Create new scheduled query:
On the new Scheduled query page, set the following:
-
Name: Update_trees_daily
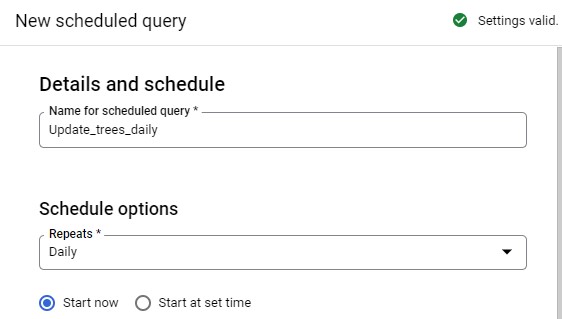
Schedule options:
- Repeats: daily, choose date and time in the future
In the Destination for query results sections, check the box for Set a destination table for query results and specify dataset name as Reports.
- Table name: type in “Trees” and select Append to table so it doesn’t overwrite existing data.
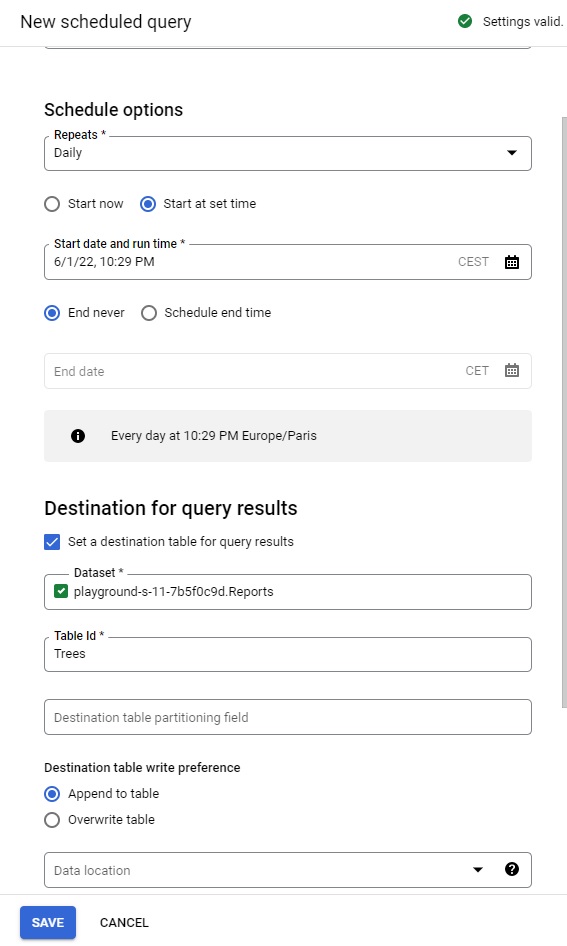
Click Save.
You may have a popup blocker enabled, click Allow and then give your lab credentials permission, then agree to replace your query.
Step 5 Create new data sources in Data Studio
Now you’ll build your dashboard using the tree data you’ve just aggregated with Data Studio.
Open a new tab in your browser and go to Data Studio with this link: https://datastudio.google.com.
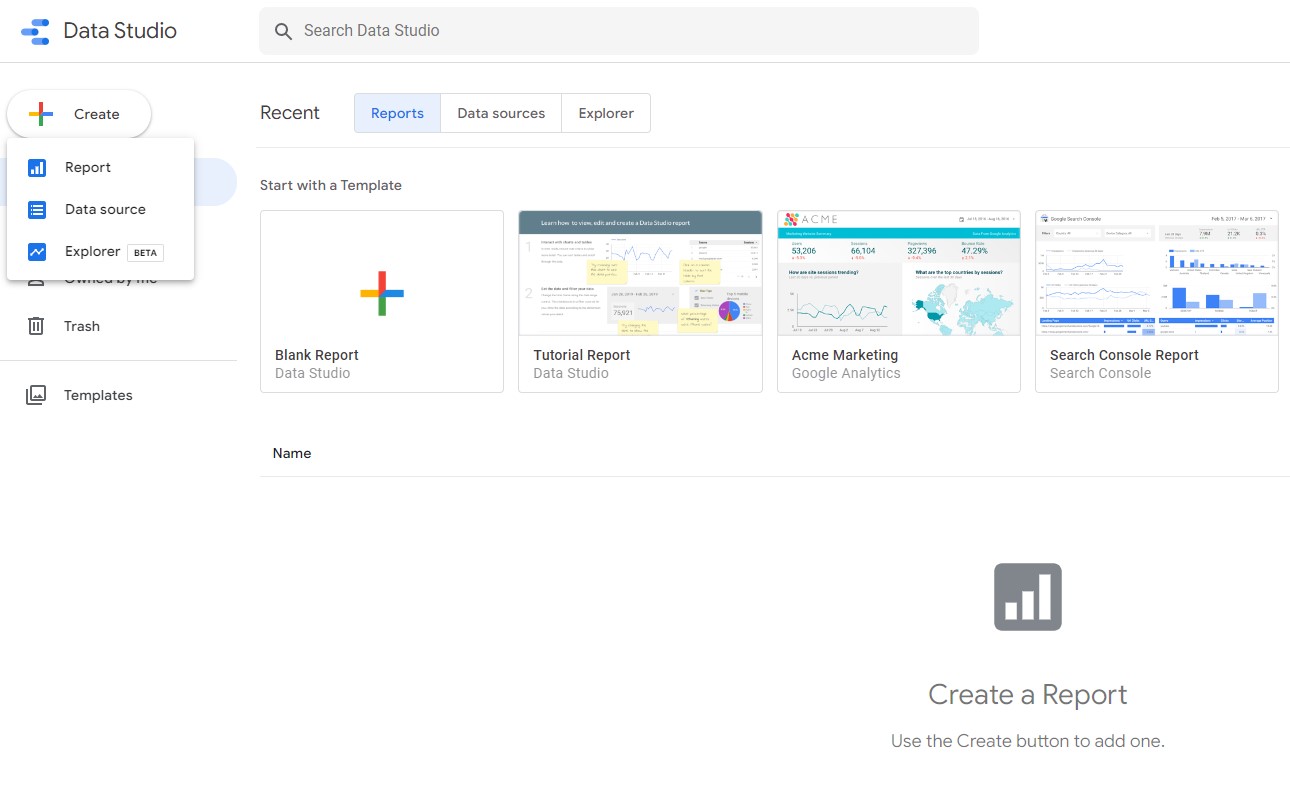
Click Create in the top left, and then click Report.
Enter the country and check the terms and conditions. Click Continue.
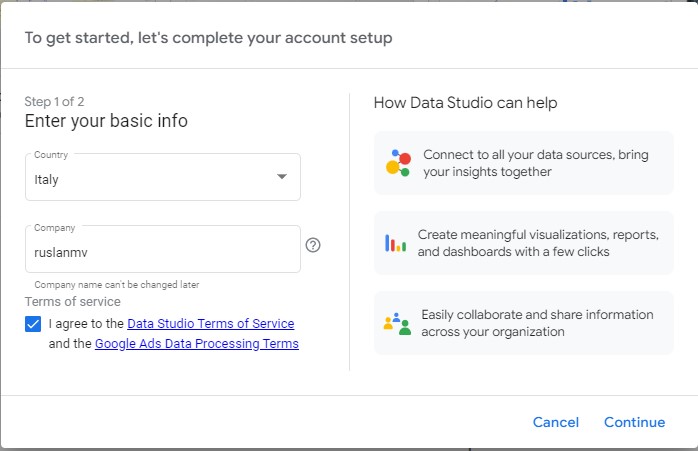
- Select No for all email offers, and then click Continue.
Create a new report in Data Studio
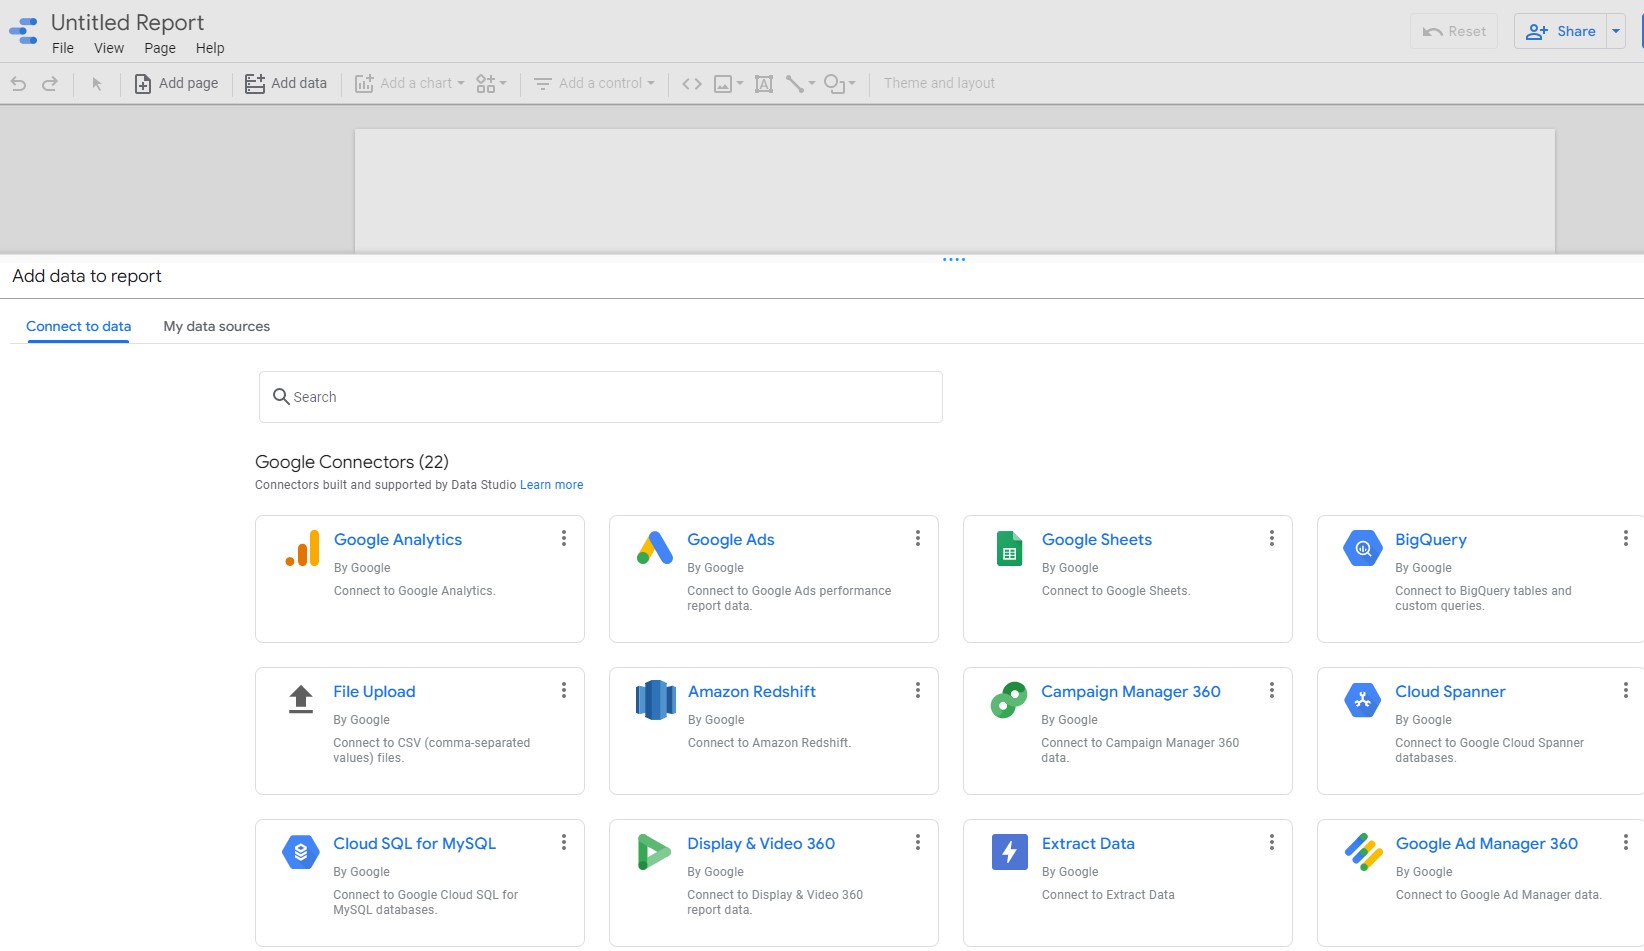
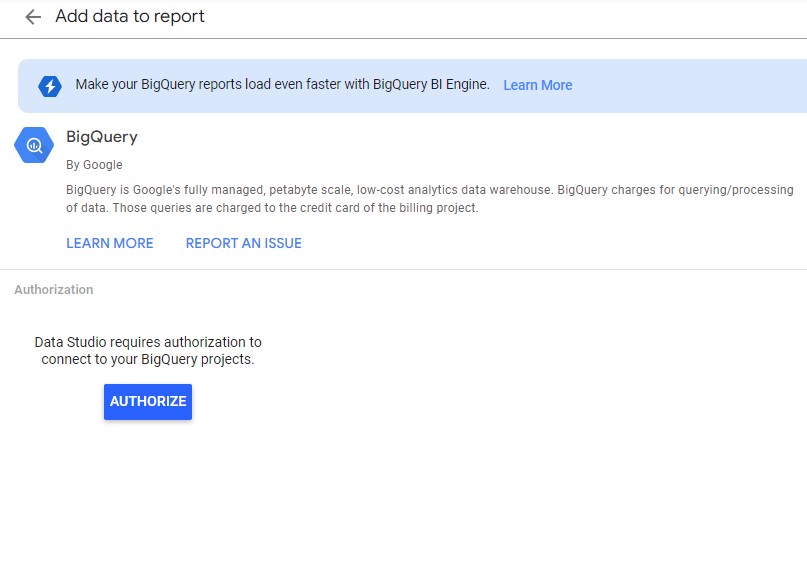
Click on the BigQuery, then click Authorize.
Now you’ll use the BigQuery connector to connect to the reports.trees table.
Start by selecting your our project, then the Reports dataset, then the Trees table, as shown below:
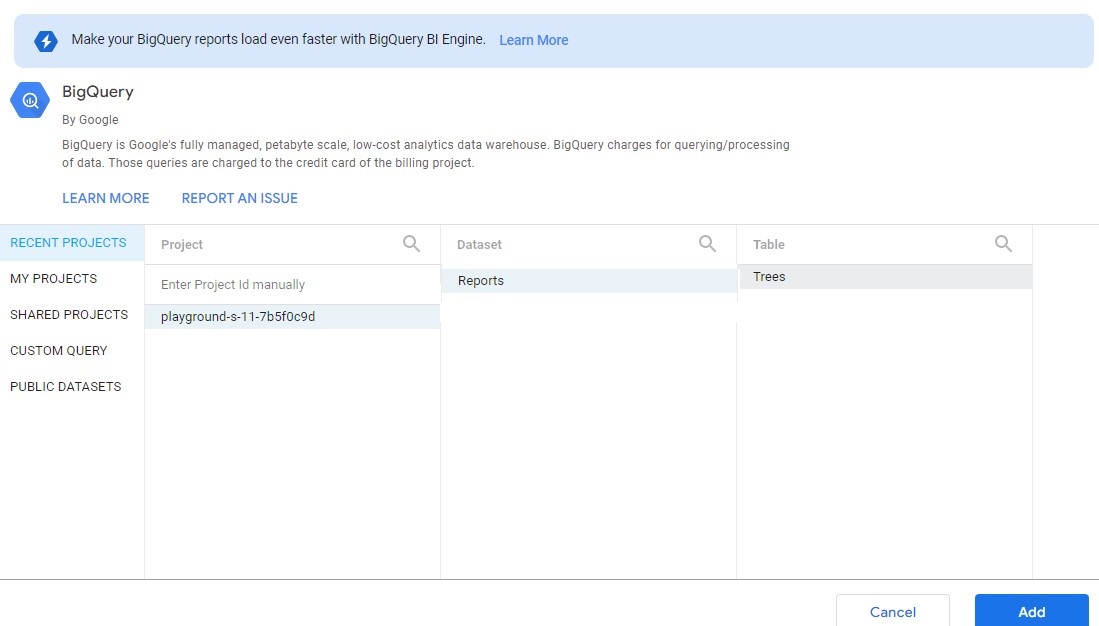
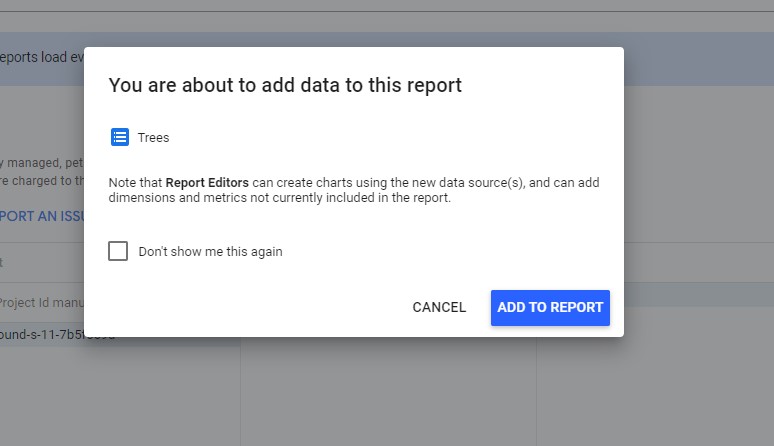
then we add to the report
Now you can create charts using the data in this table.
Click on Add a chart dropdown and select the type you want.
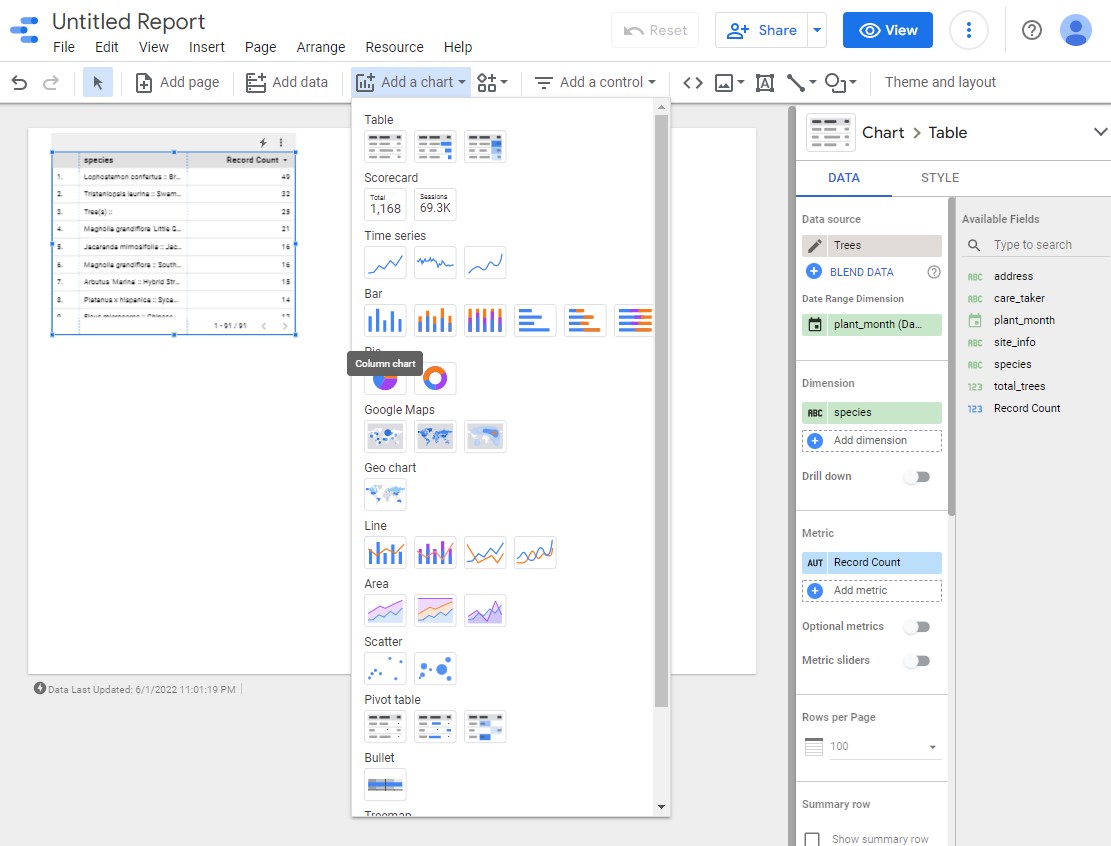
In this example, you can see the following types of charts:
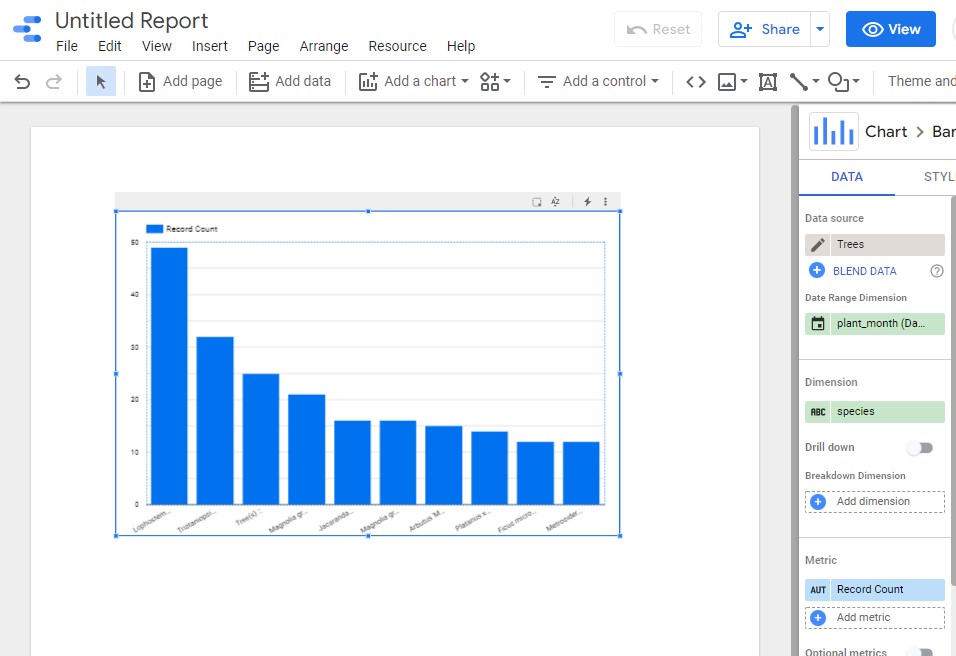
- For example for Stacked column bar graph showing the number of trees by species by record count
-
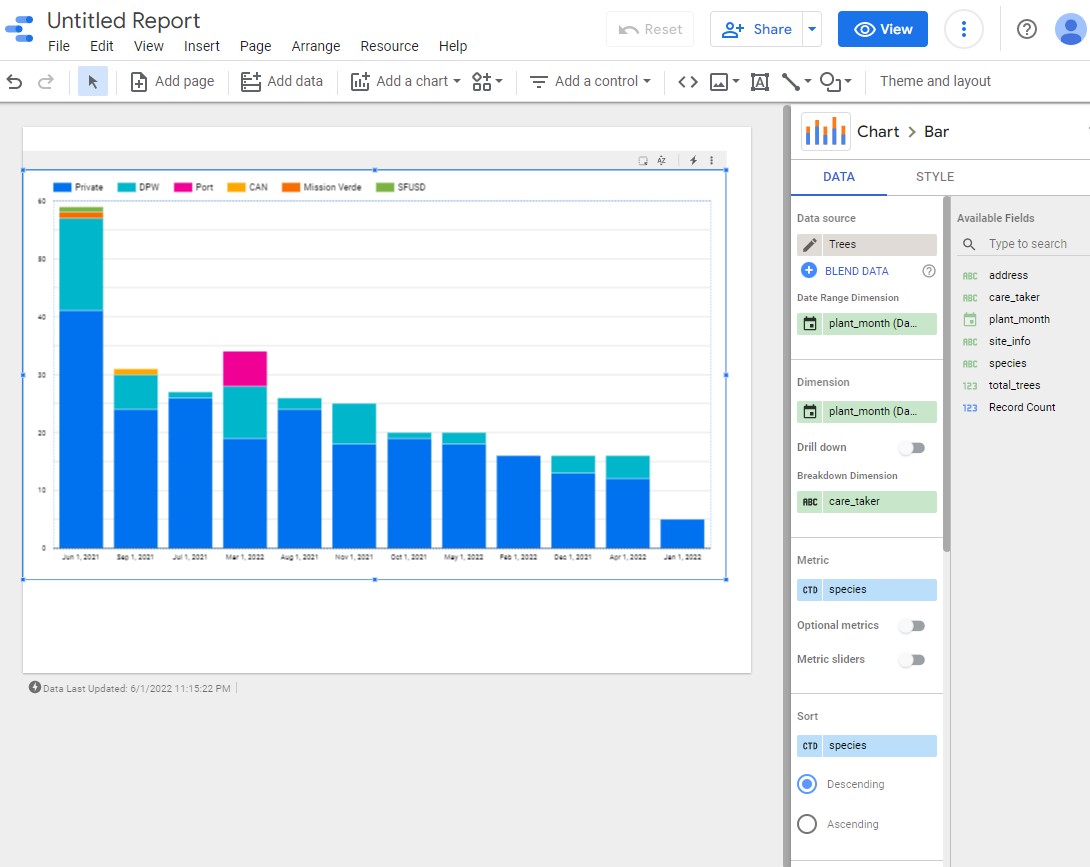
Stacked column bar graph showing the number of trees planted each month and the name of the caretaker who planted them.
-
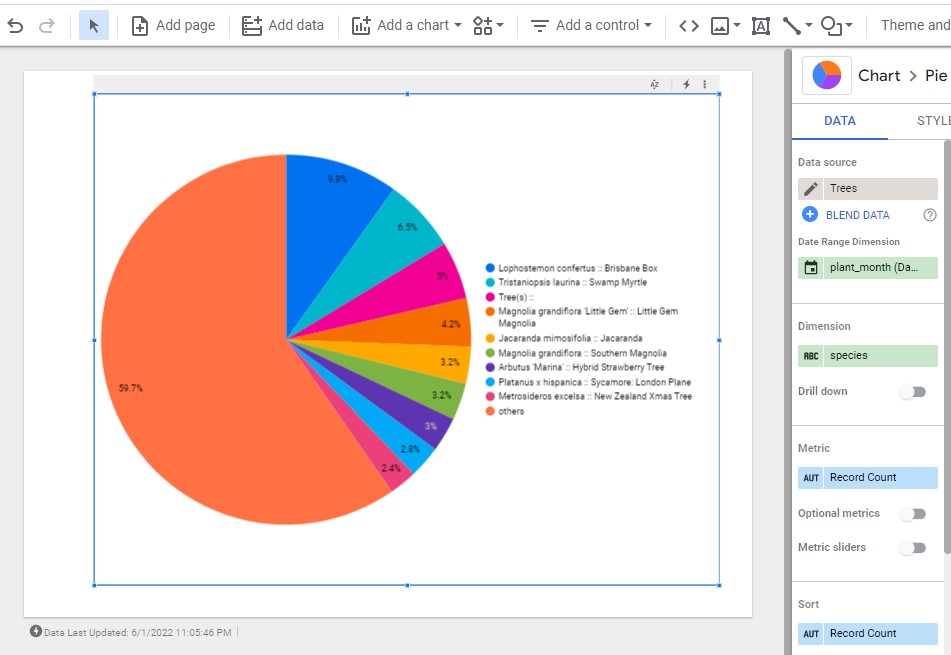
A pie chart showing the percent distribution of trees planted by their species.
-
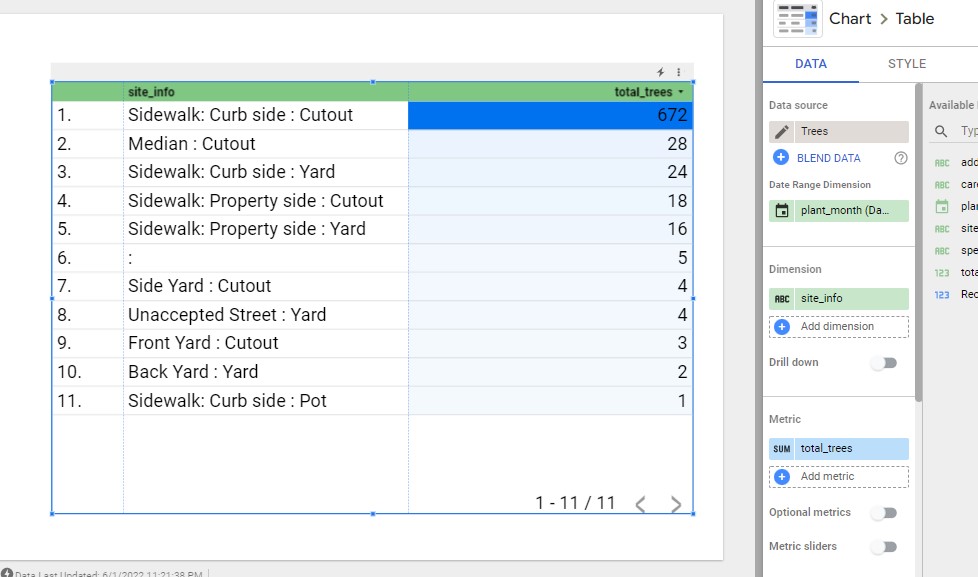
A table chart along with a bar graph representing the number of trees planted by site.
Here are some hints:
- Titles are created using the text tool. In the example, titles were created for each chart and the dashboard itself.
- When a chart is selected, you can edit the colors and font sizes when you click on the Style tab on the right-hand side.
- Click on a chart to modify its size and drag it to a new location.
Congratulations!
You’ve learned how to build a BI dashboard for visualizing patterns in your business data
Leave a comment