
Machine Learning Web App with Streamlit and Python
Today we are going to install a Machine Learning Web App with Streamlit and Python on MacOs.
![]()
Streamlit is an open-source app framework for Machine Learning and Data Science teams. Create beautiful data apps in hours, not weeks. All in pure Python. In this project first we are going to install and write the code to perfom classsifications.
Install Streamlit on macOS
Streamlit’s officially-supported environment manager for macOS and Linux is Pipenv. See instructions on how to install and use it below.
Install Pipenv
-
Install
pip.On a macOS:
sudo easy_install pip -
Install
pipenv.pip3 install pipenv
Create a new environment with Streamlit
-
Navigate to your project folder:
cd myproject -
Create a new Pipenv environment in that folder and activate that environment:
pipenv shellWhen you run the command above, a file called
Pipfilewill appear inmyprojects/. This file is where your Pipenv environment and its dependencies are declared. -
Install Streamlit in your environment:
pip install streamlitOr if you want to create an easily-reproducible environment, replace
pipwithpipenvevery time you install something:pipenv install streamlit -
Test that the installation worked:
streamlit helloStreamlit’s Hello app should appear in a new tab in your web browser!

-
For this project we need install two libraries, ** sklearn**
pip install sklearn
and for visualization ** matplotlib**
pip install matplotlib
In the next section are going to load, explore, visualize and interact with data, and generate dashboards. Our web application will allows users to choose what classification algorithm they want to use and let them interactively set hyper-parameter values.
Load the Mushrooms Data Set
We are going to download the dataset from the UC Irvine Machine Learning Repository!
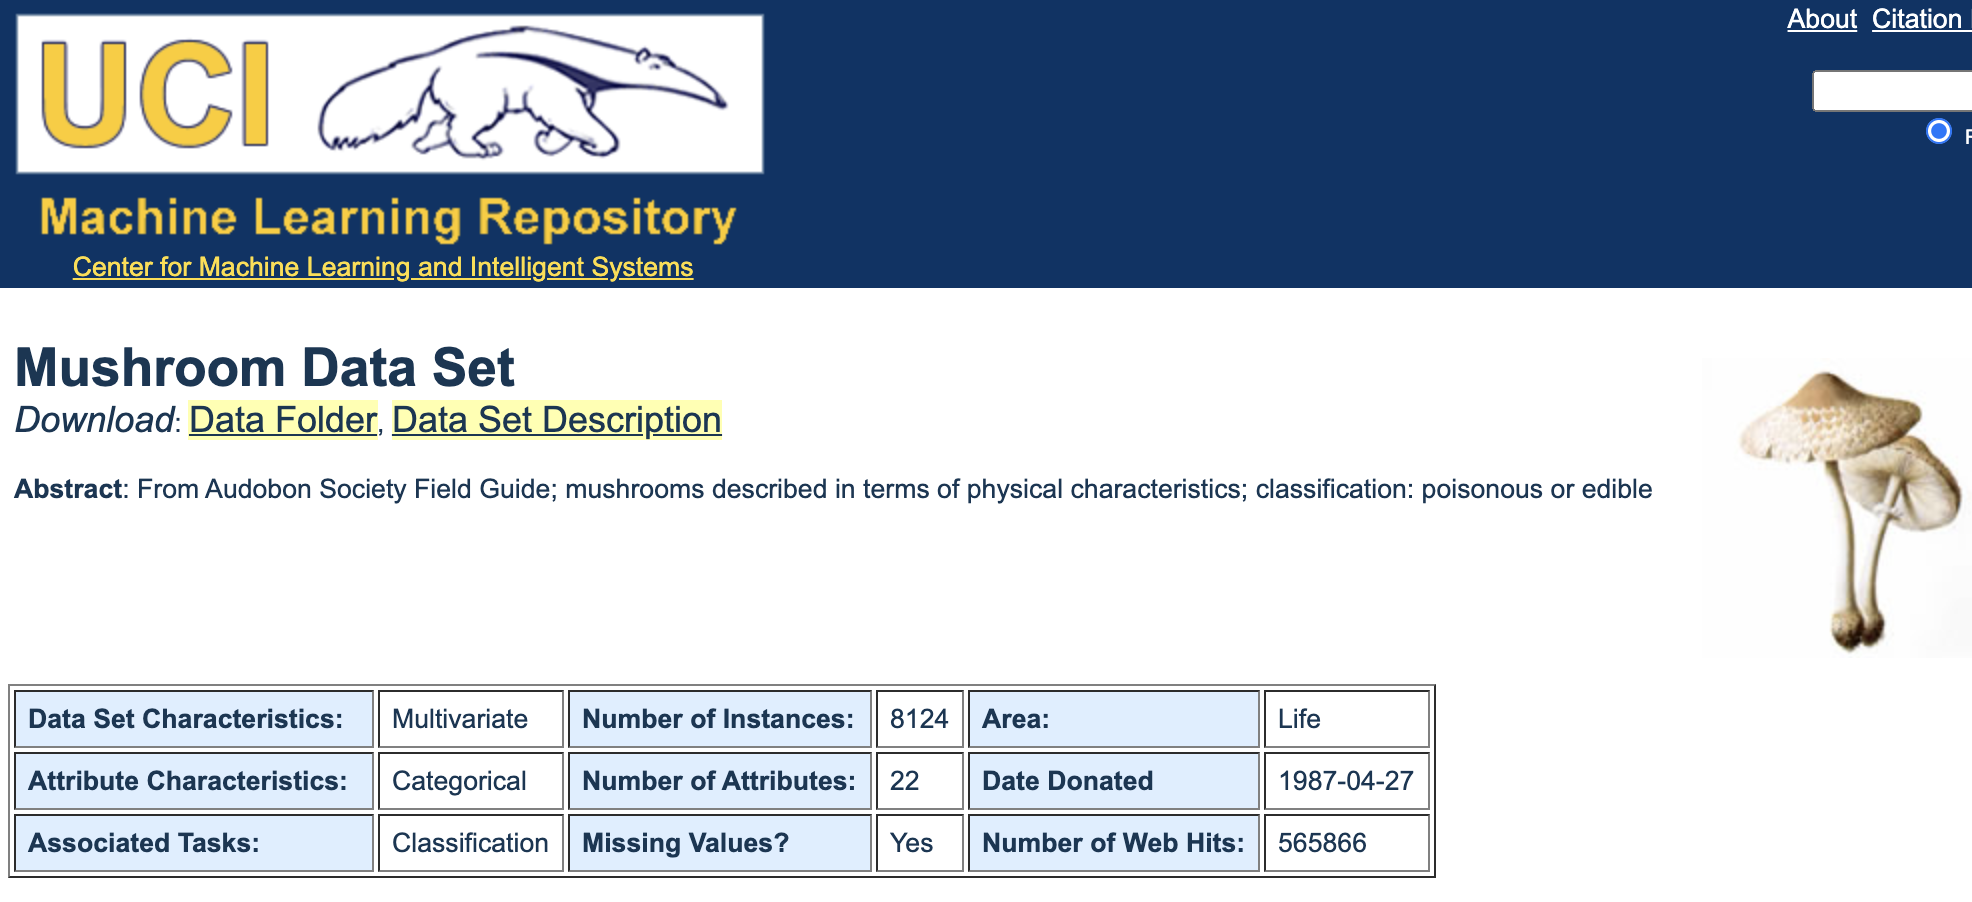
http://archive.ics.uci.edu/ml/datasets/Mushroom?ref=datanews.io
you can download the csv file here
https://github.com/ruslanmv/Machine-Learning-Web-App-with-Streamlit/raw/main/mushrooms.csv
Creating the app.py program
We are going to go to the folder of the project from the terminal
cd myproject
and there you copy the dataset
curl https://github.com/ruslanmv/Machine-Learning-Web-App-with-Streamlit/raw/main/mushrooms.csv --output mushrooms.cs
and there we create the app.py program, by using any code editor, and create a an app.py file
atom app.py
and there we can write the main structure of the program
import streamlit as st
import pandas as pd
import numpy as np
from sklearn.svm import SVC
from sklearn.linear_model import LogisticRegression
from sklearn.ensemble import RandomForestClassifier
from sklearn.preprocessing import LabelEncoder
from sklearn.model_selection import train_test_split
from sklearn.metrics import plot_confusion_matrix, plot_roc_curve, plot_precision_recall_curve
from sklearn.metrics import precision_score, recall_score


def main():
    st.title("Binary Classification Web App")


if __name__ == '__main__':
    main()
you can execute this program to know if streamlit is working in your current directory
streamit run app.py
Let introduce the parts of the full code.
The reading part
    @st.cache(persist=True)
    def load_data():
        data = pd.read_csv('mushrooms.csv')
        label = LabelEncoder()
        for col in data.columns:
            data[col] = label.fit_transform(data[col])
        return data

 df = load_data()
    class_names = ['edible', 'poisonous']

    x_train, x_test, y_train, y_test = split(df)
Training and Test splitting
    @st.cache(persist=True)
    def split(df):
        y = df.type
        x = df.drop(columns =['type'])
        x_train, x_test, y_train, y_test = train_test_split(x, y, test_size=0.3, random_state=0)
        return x_train, x_test, y_train, y_test
Plot Evaluation Metrics
def plot_metrics(metrics_list):
if 'Confusion Matrix' in metrics_list:
st.subheader("Confusion Matrix")
plot_confusion_matrix(model, x_test, y_test, display_labels=class_names)
st.pyplot()
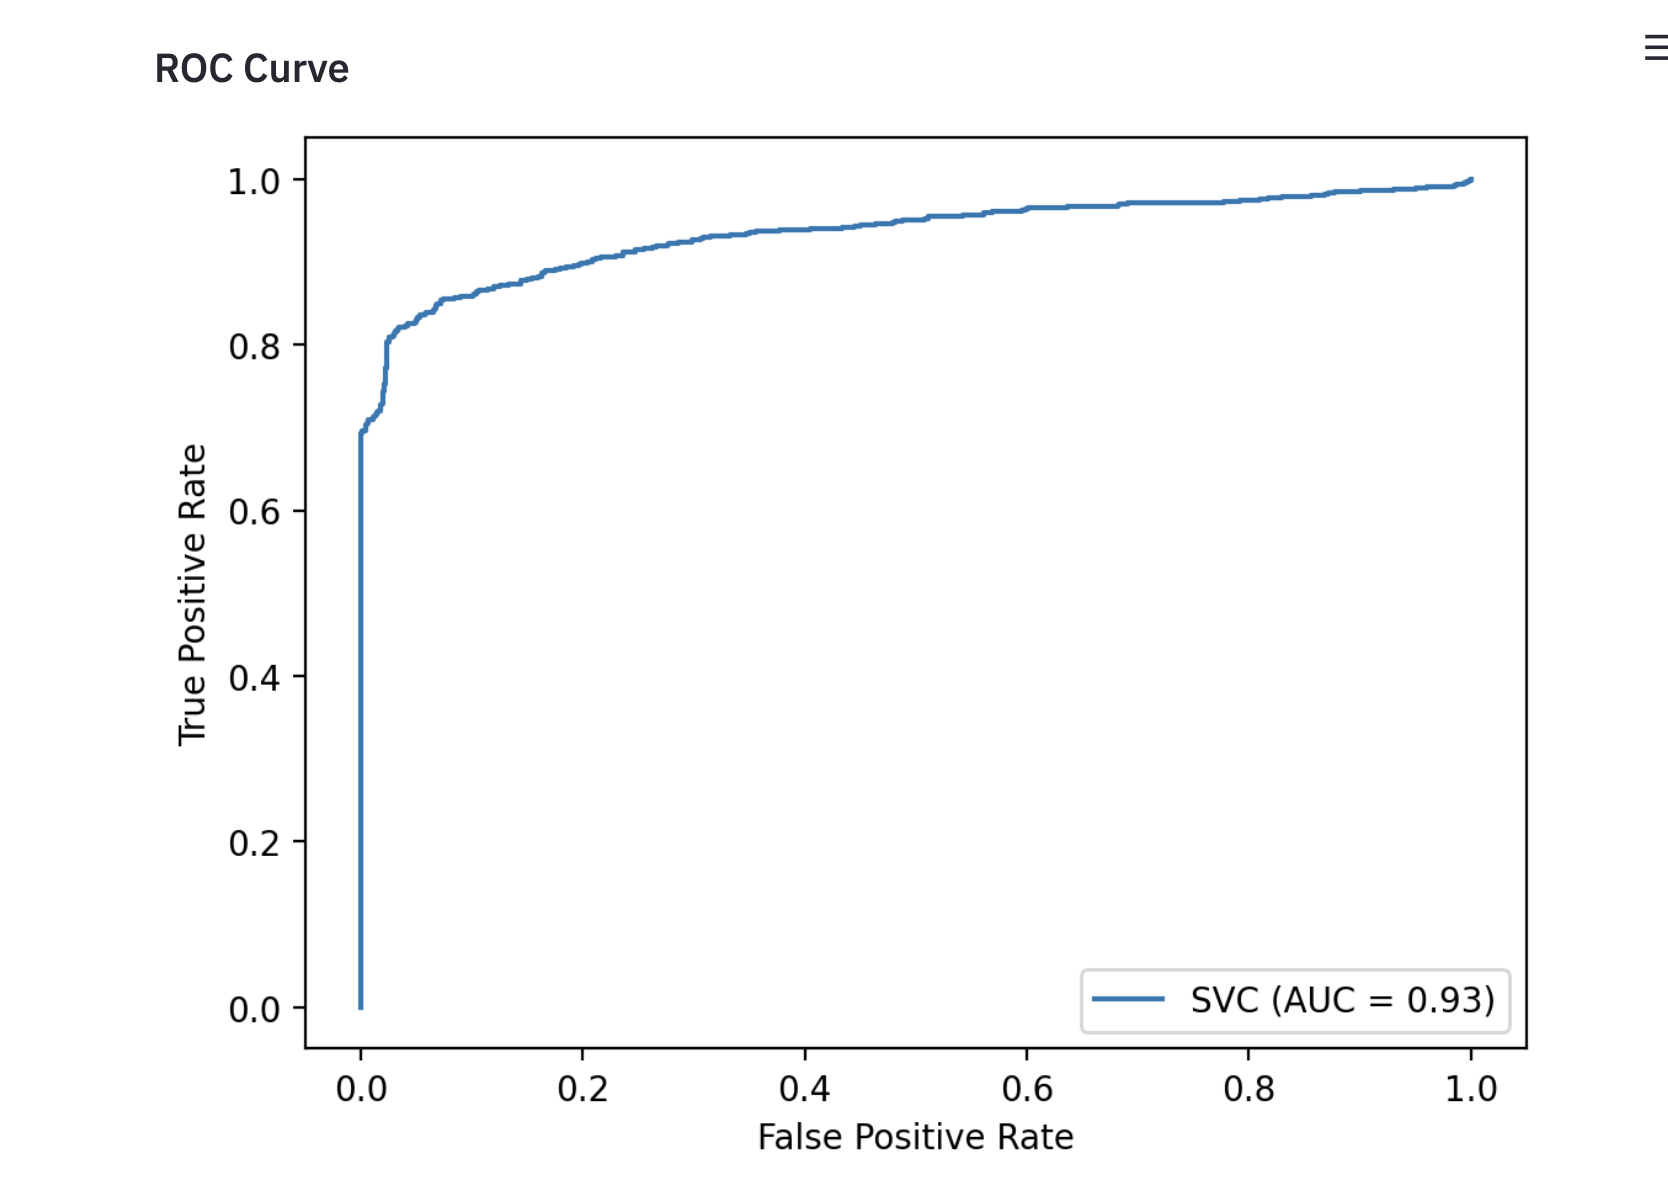
if 'ROC Curve' in metrics_list:
st.subheader("ROC Curve")
plot_roc_curve(model, x_test, y_test)
st.pyplot()
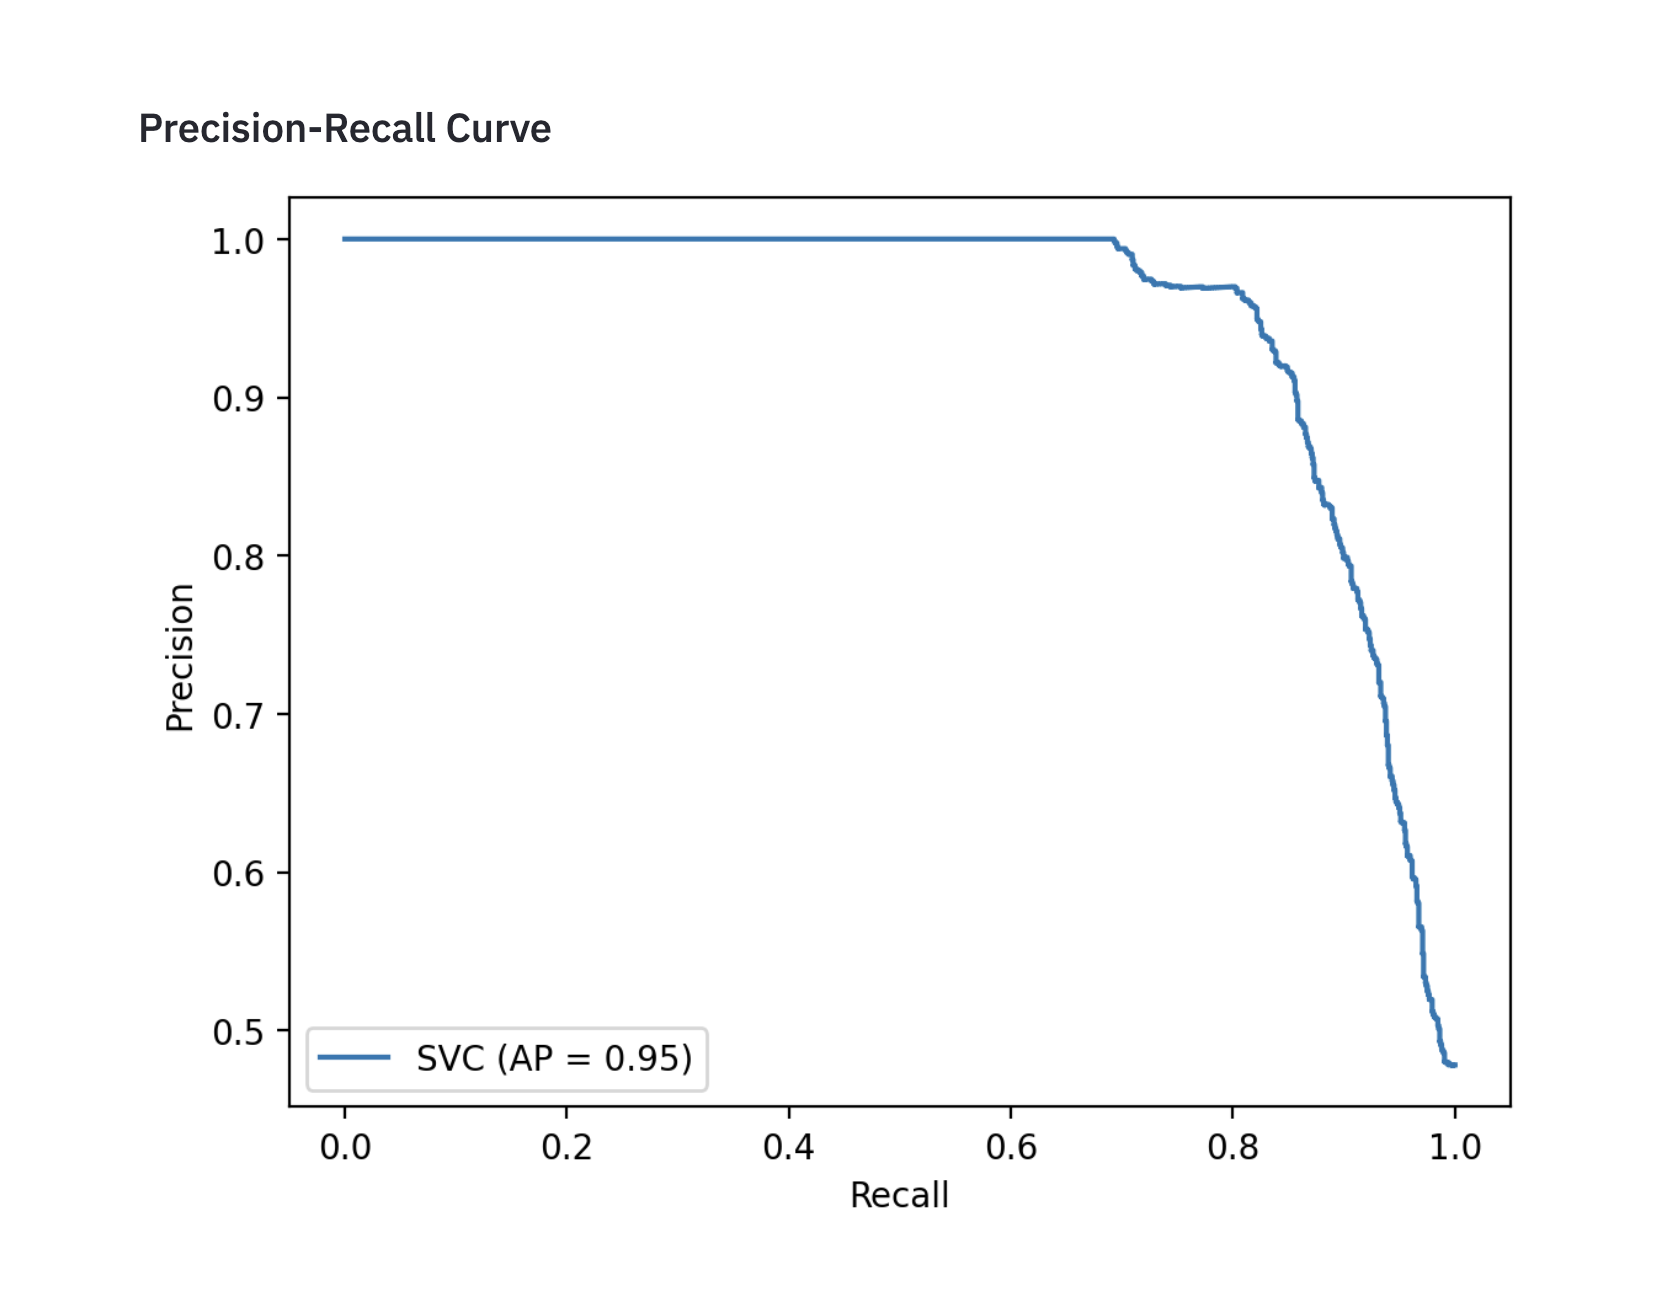
if 'Precision-Recall Curve' in metrics_list:
st.subheader("Precision-Recall Curve")
plot_precision_recall_curve(model, x_test, y_test)
st.pyplot()
Training a Support Vector Classifier
    if classifier == 'Support Vector Machine (SVM)':
        st.sidebar.subheader("Model Hyperparameters")
        C = st.sidebar.number_input("C (Regularizaion parameter)", 0.01, 10.0, step=0.01, key='C')
        kernel = st.sidebar.radio("Kernel",("rbf", "linear"), key='kernel')
        gamma = st.sidebar.radio("Gamma (Kernel Coefficient", ("scale", "auto"), key = 'gamma')
        metrics = st.sidebar.multiselect("What metrics to plot?",('Confusion Matrix', 'ROC Curve', 'Precision-Recall Curve'))


        if st.sidebar.button("Classfiy", key='classify'):
            st.subheader("Support Vector Machine (SVM Results")
            model = SVC(C=C, kernel=kernel, gamma=gamma)
            model.fit(x_train, y_train)
            accuracy = model.score(x_test, y_test)
            y_pred = model.predict(x_test)
            st.write("Accuracy ", accuracy.round(2))
            st.write("Precision: ", precision_score(y_test, y_pred, labels=class_names).round(2))
            st.write("Recall: ", recall_score(y_test, y_pred, labels=class_names).round(2))
            plot_metrics(metrics)
Train a Logistic Regression Classifier
    if classifier == 'Logistic Regression':
        st.sidebar.subheader("Model Hyperparameters")
        C = st.sidebar.number_input("C (Regularizaion parameter)", 0.01, 10.0, step=0.01, key='C_LR')
        max_iter = st.sidebar.slider("Maxiumum number of interations", 100, 500, key='max_iter')
        metrics = st.sidebar.multiselect("What metrics to plot?",('Confusion Matrix', 'ROC Curve', 'Precision-Recall Curve'))

        if st.sidebar.button("Classfiy", key='classify'):
            st.subheader("Logistic Regression Results")
            model = LogisticRegression(C=C, max_iter=max_iter)
            model.fit(x_train, y_train)
            accuracy = model.score(x_test, y_test)
            y_pred = model.predict(x_test)
            st.write("Accuracy ", accuracy.round(2))
            st.write("Precision: ", precision_score(y_test, y_pred, labels=class_names).round(2))
            st.write("Recall: ", recall_score(y_test, y_pred, labels=class_names).round(2))
            plot_metrics(metrics)
Training a Random Forest Classifier
    if classifier == 'Random Forest':
        st.sidebar.subheader("Model Hyperparameters")
        n_estimators  = st.sidebar.number_input("The number of trees in the forest", 100, 5000, step=10, key='n_estimators')
        max_depth = st.sidebar.number_input("The maximum depth of the tree", 1, 20, step=1, key='max_depth')
        bootstrap = st.sidebar.radio("Bootstrap samples when building trees", ('True','False'), key='bootstrap')
        metrics = st.sidebar.multiselect("What metrics to plot?",('Confusion Matrix', 'ROC Curve', 'Precision-Recall Curve'))

        if st.sidebar.button("Classfiy", key='classify'):
            st.subheader("")
            model = RandomForestClassifier(n_estimators=n_estimators, max_depth=max_depth, bootstrap=bootstrap, n_jobs=-1)
            model.fit(x_train, y_train)
            accuracy = model.score(x_test, y_test)
            y_pred = model.predict(x_test)
            st.write("Accuracy ", accuracy.round(2))
            st.write("Precision: ", precision_score(y_test, y_pred, labels=class_names).round(2))
            st.write("Recall: ", recall_score(y_test, y_pred, labels=class_names).round(2))
            plot_metrics(metrics)
Ans you can get the following program:
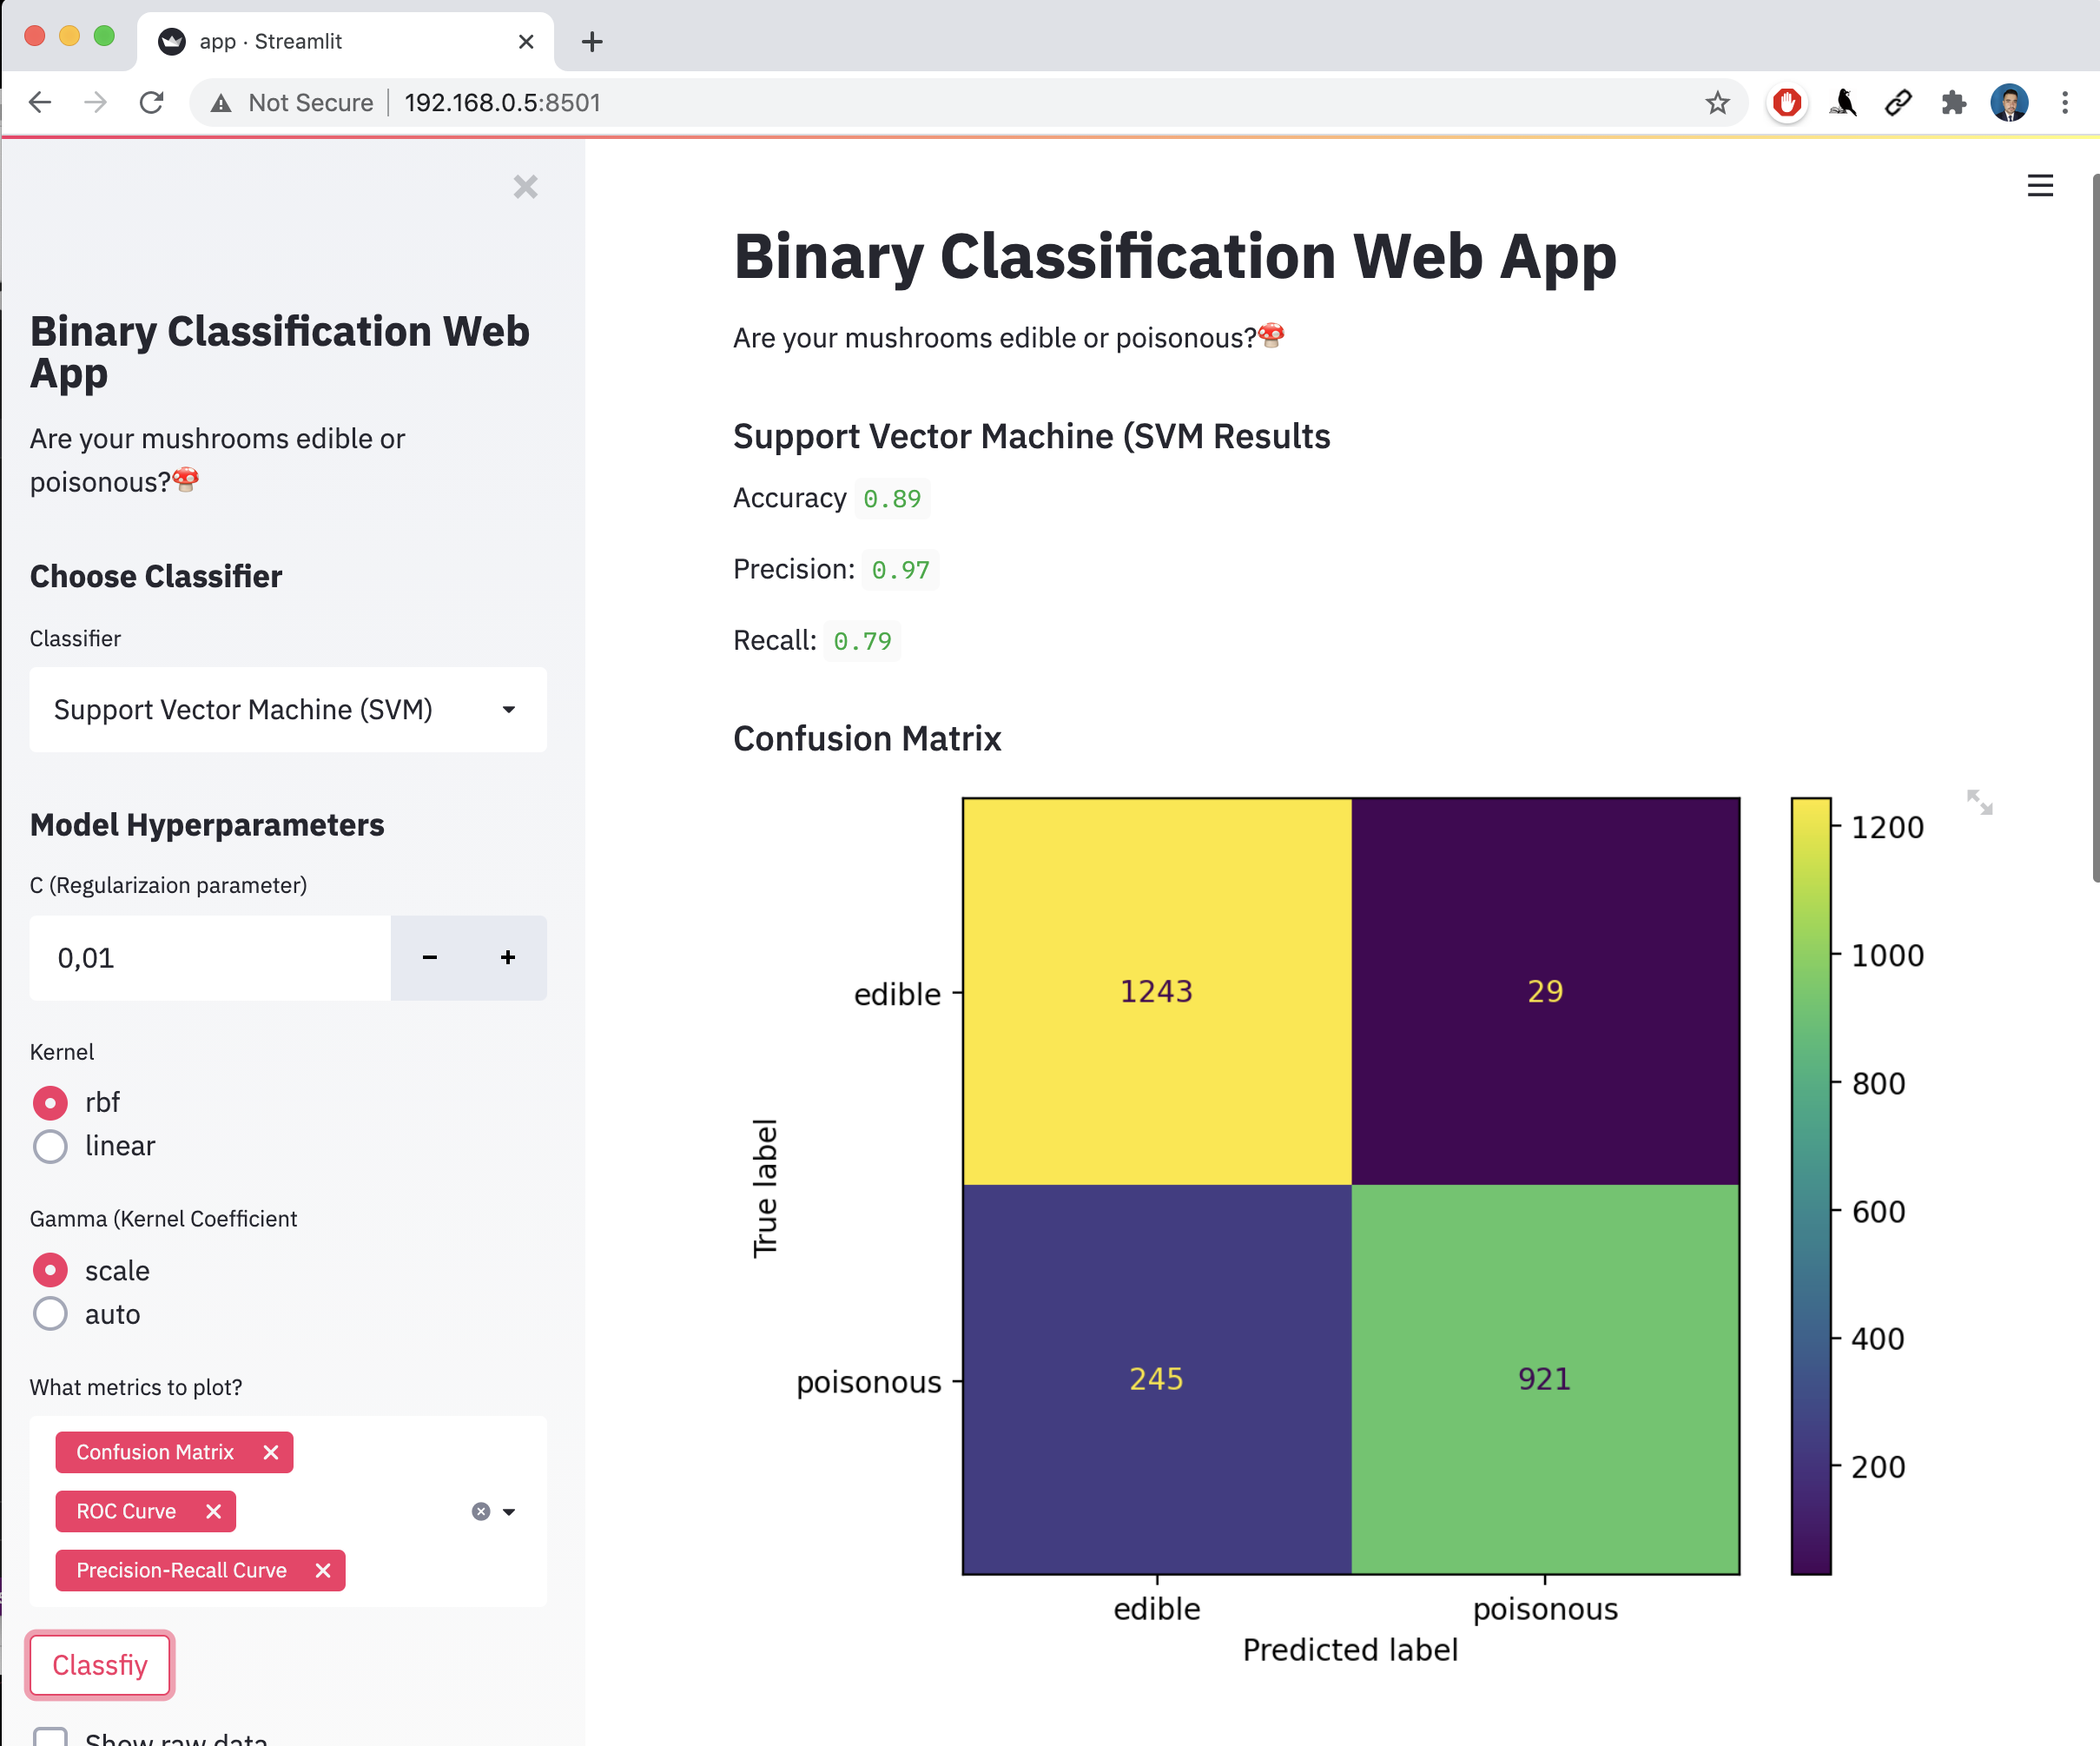
With the plots of ROC Curve and Preceision Recall Curve
Full code
import streamlit as st
import pandas as pd
import numpy as np
from sklearn.svm import SVC
from sklearn.linear_model import LogisticRegression
from sklearn.ensemble import RandomForestClassifier
from sklearn.preprocessing import LabelEncoder
from sklearn.model_selection import train_test_split
from sklearn.metrics import plot_confusion_matrix, plot_roc_curve, plot_precision_recall_curve
from sklearn.metrics import precision_score, recall_score
def main():
    st.title("Binary Classification Web App")
    st.sidebar.title("Binary Classification Web App")
    st.markdown("Are your mushrooms edible or poisonous?🍄")
    st.sidebar.markdown("Are your mushrooms edible or poisonous?🍄")


    @st.cache(persist=True)
    def load_data():
        data = pd.read_csv('mushrooms.csv')
        label = LabelEncoder()
        for col in data.columns:
            data[col] = label.fit_transform(data[col])
        return data

    @st.cache(persist=True)
    def split(df):
        y = df.type
        x = df.drop(columns =['type'])
        x_train, x_test, y_train, y_test = train_test_split(x, y, test_size=0.3, random_state=0)
        return x_train, x_test, y_train, y_test


    def plot_metrics(metrics_list):
        st.set_option('deprecation.showPyplotGlobalUse', False)


        if 'Confusion Matrix' in metrics_list:
            st.subheader("Confusion Matrix")
            plot_confusion_matrix(model, x_test, y_test, display_labels=class_names)
            st.pyplot()

        if 'ROC Curve' in metrics_list:
            st.subheader("ROC Curve")
            plot_roc_curve(model, x_test, y_test)
            st.pyplot()

        if 'Precision-Recall Curve' in metrics_list:
            st.subheader("Precision-Recall Curve")
            plot_precision_recall_curve(model, x_test, y_test)
            st.pyplot()


    df = load_data()
    class_names = ['edible', 'poisonous']

    x_train, x_test, y_train, y_test = split(df)

    st.sidebar.subheader("Choose Classifier")
    classifier = st.sidebar.selectbox("Classifier", ("Support Vector Machine (SVM)", "Logistic Regression", "Random Forest"))

    if classifier == 'Support Vector Machine (SVM)':
        st.sidebar.subheader("Model Hyperparameters")
        C = st.sidebar.number_input("C (Regularizaion parameter)", 0.01, 10.0, step=0.01, key='C')
        kernel = st.sidebar.radio("Kernel",("rbf", "linear"), key='kernel')
        gamma = st.sidebar.radio("Gamma (Kernel Coefficient", ("scale", "auto"), key = 'gamma')
        metrics = st.sidebar.multiselect("What metrics to plot?",('Confusion Matrix', 'ROC Curve', 'Precision-Recall Curve'))

        if st.sidebar.button("Classfiy", key='classify'):
            st.subheader("Support Vector Machine (SVM Results")
            model = SVC(C=C, kernel=kernel, gamma=gamma)
            model.fit(x_train, y_train)
            accuracy = model.score(x_test, y_test)
            y_pred = model.predict(x_test)
            st.write("Accuracy ", accuracy.round(2))
            st.write("Precision: ", precision_score(y_test, y_pred, labels=class_names).round(2))
            st.write("Recall: ", recall_score(y_test, y_pred, labels=class_names).round(2))
            plot_metrics(metrics)

    if classifier == 'Logistic Regression':
        st.sidebar.subheader("Model Hyperparameters")
        C = st.sidebar.number_input("C (Regularizaion parameter)", 0.01, 10.0, step=0.01, key='C_LR')
        max_iter = st.sidebar.slider("Maxiumum number of interations", 100, 500, key='max_iter')
        metrics = st.sidebar.multiselect("What metrics to plot?",('Confusion Matrix', 'ROC Curve', 'Precision-Recall Curve'))

        if st.sidebar.button("Classfiy", key='classify'):
            st.subheader("Logistic Regression Results")
            model = LogisticRegression(C=C, max_iter=max_iter)
            model.fit(x_train, y_train)
            accuracy = model.score(x_test, y_test)
            y_pred = model.predict(x_test)
            st.write("Accuracy ", accuracy.round(2))
            st.write("Precision: ", precision_score(y_test, y_pred, labels=class_names).round(2))
            st.write("Recall: ", recall_score(y_test, y_pred, labels=class_names).round(2))
            plot_metrics(metrics)


    if classifier == 'Random Forest':
        st.sidebar.subheader("Model Hyperparameters")
        n_estimators  = st.sidebar.number_input("The number of trees in the forest", 100, 5000, step=10, key='n_estimators')
        max_depth = st.sidebar.number_input("The maximum depth of the tree", 1, 20, step=1, key='max_depth')
        bootstrap = st.sidebar.radio("Bootstrap samples when building trees", ('True','False'), key='bootstrap')
        metrics = st.sidebar.multiselect("What metrics to plot?",('Confusion Matrix', 'ROC Curve', 'Precision-Recall Curve'))

        if st.sidebar.button("Classfiy", key='classify'):
            st.subheader("")
            model = RandomForestClassifier(n_estimators=n_estimators, max_depth=max_depth, bootstrap=bootstrap, n_jobs=-1)
            model.fit(x_train, y_train)
            accuracy = model.score(x_test, y_test)
            y_pred = model.predict(x_test)
            st.write("Accuracy ", accuracy.round(2))
            st.write("Precision: ", precision_score(y_test, y_pred, labels=class_names).round(2))
            st.write("Recall: ", recall_score(y_test, y_pred, labels=class_names).round(2))
            plot_metrics(metrics)


    if st.sidebar.checkbox("Show raw data", False):
        st.subheader("Mushroom Data Set (Classification)")
        st.write(df)


if __name__ == '__main__':
    main()
You can download it from https://github.com/ruslanmv/Machine-Learning-Web-App-with-Streamlit/blob/main/app.py
Use your new environment
-
Any time you want to use the new environment, you first need to go to your project folder (where the
Pipenvfile lives) and run:pipenv shell -
Now you can use Python and Streamlit as usual:
streamlit run myfile.py -
When you’re done using this environment, just type
exitor pressctrl-Dto return to your normall shell.
Congratulations! We have Build a web app to classify mushrooms. I hope you enjoy it!
Leave a comment